Key figures
FY2025 (31 December 2025), if not indicated otherwise.
Financial Guidance
The figures of the guidance 2026 as mentioned below were calculated on the same basis as the actual figures for 2025 and based on current rules and regulations.
2026 Revenue
High single-digit % to low double-digit (in CER)
Updated as per 26 February 2026
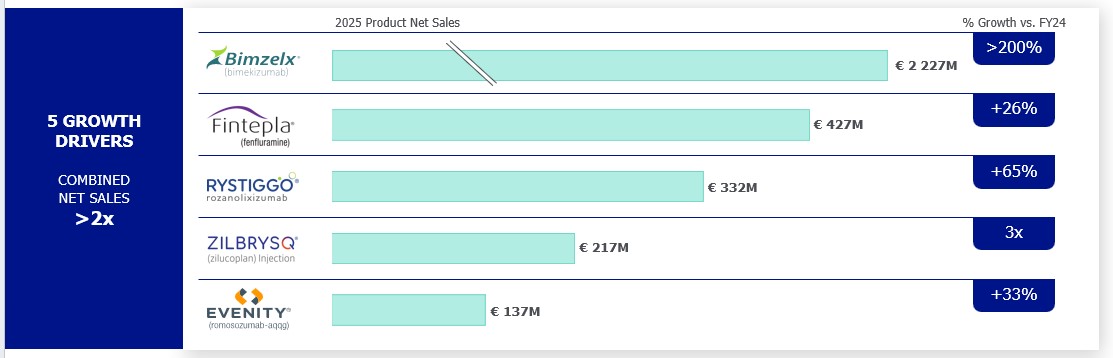
Strong growth driven by BIMZELX®, FINTEPLA®, RYSTIGGO®, ZILBRYSQ®, EVENITY®, BRIVIACT®, with BIMZELX® access expansion & net pricing dynamics, Briviact LOE and a perimeter effect from sale of non-core assets in 2025
2026 adj. EBITDA
High single-digit % to High teens %
Updated as per 26 February 2026
Adjusted for 2025 product sale & one-off items*: High teens % to high twenties %
By continued investment behind 5 growth drivers, focused R&D execution and Evenity contribution
*Excludes the benefit from a sale of established brands and one-off expenses
FX impact
If 31-Dec-25 FX rates would persist through 2026:
- ~ -3 ppts on revenue growth
- ~ -7 ppts on adjusted EBITDA growth
Product Sales
Strong launch execution & disciplined value creation in FY25
BRIVIACT®
peak sales guidance
≥ € 600 million by 2026
achieved ahead of time in 2024
FINTEPLA®
peak sales guidance
≥ € 800 million by 2027
BIMZELX®
peak sales guidancet
> € 4 billion
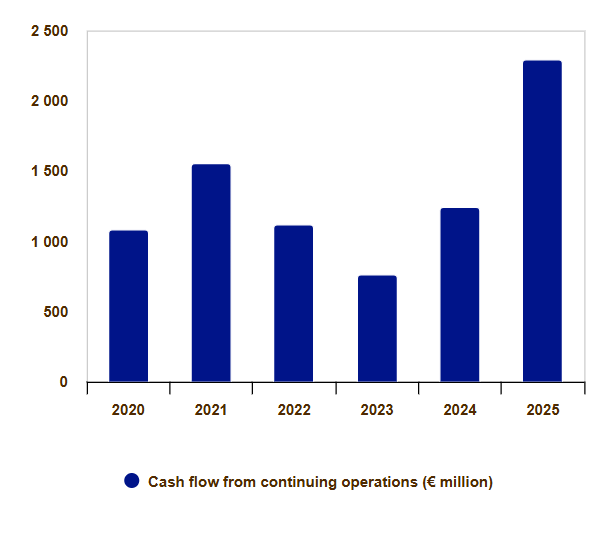
Cash Flows
Per December 2025, the evolution of cash flow generated by biopharmaceuticals activities is affected by the following::
- Cash flow from operating activities amounted to € 2 291 million compared to € 1 242 million in 2024. The cash inflow stems from underlying net profitability and working capital including higher outstanding payables at year-end partially offset by an increase in inventories linked to the five product growth drivers and higher outstanding receivables reflecting the growing net sales.
- Cash flow from investing activities showed an outflow of € 389 million compared to an inflow of € 282 million in 2024. The 2025 investing activities mainly include € 449 million capital expenditures offset by proceeds from the sale of other investments of € 88 million. The 2024 cash flow from investing activities was mainly driven by the proceeds from the divestment of UCB’s mature neurology and allergy business in China.
- Cash flow from financing activities represented a net outflow of € 1 214 million, mainly driven by the voluntarily prepayment of certain loans (€ 641 million) absent issuance of new debt, the dividend paid to UCB shareholders (€ -264 million), the acquisition of treasury shares ( € -121 million) and interests paid ( € -128 million).